*Even a full year beyond the arrival of the novel coronavirus and the ensuing lockdowns, shutdowns, and mass quarantines, the threat of COVID-19 continues to cause significant delays and disruptions in both normal life and in business supply chains.
Appliances, computer chips, and industrial parts have been on backorder for months, outdoor equipment and gear is hard to find, prices on everything from lumber to chicken are up, and many employees are still working from home—if they’re working at all.
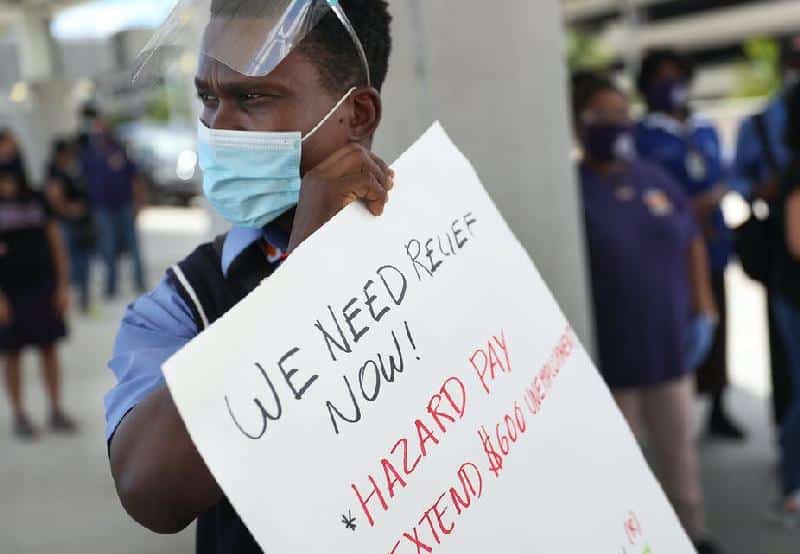
Tremendous losses in the tourism, dining, and entertainment industries in particular initially hit Americans hard irrespective of who they were or where they lived. However, now that the dust has settled, it’s clear that not everyone suffered equally. The disparities between those who could work from home and those who couldn’t are showing up in the still-long (virtual) unemployment lines.
2020 saw a tripling of the unemployment rate, from an overall 3.5% in February to a peak of 14.8% just two months later in April, according to BLS statistics. The unemployment rate had never spiked that high in the 73-year BLS record, and it had only ever topped 8% three times before: in 1975, 1982-83, and 2009-12.
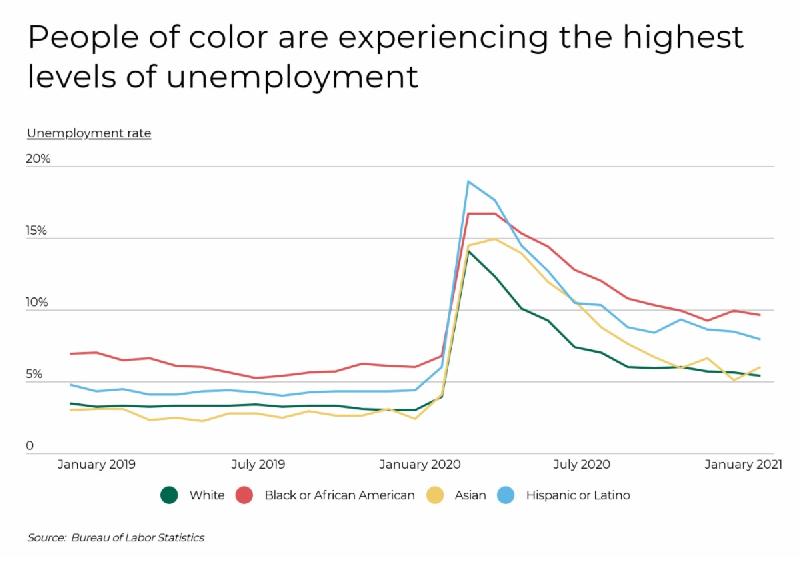
While unemployment among white Americans surged from 3% to 14.1% between February and April of 2020, Hispanics and Latinos lost jobs more quickly. Their rate soared from 4.4% to 18.9%, the highest peak of all demographic groups. Blacks and African Americans began the pandemic at a higher unemployment rate, 6%, and experienced the next-highest peak at 16.7%.
The recovery since April 2020 has not treated demographic groups equally either. The jobless rate among Hispanics and Latinos dropped below blacks and African Americans by June of last year, and this spring black unemployment persisted at near 10%, much higher than the 7.9% rate for Hispanics, 6% for Asians, and 5.4% for whites. Even the latest rates, though, are still twice as high as they were pre-pandemic in some cases.
MORE NEWS ON EURWEB: Houston Hospital Sued by Over 100 Staffers for COVID-19 Vaccine Mandate [VIDEO]
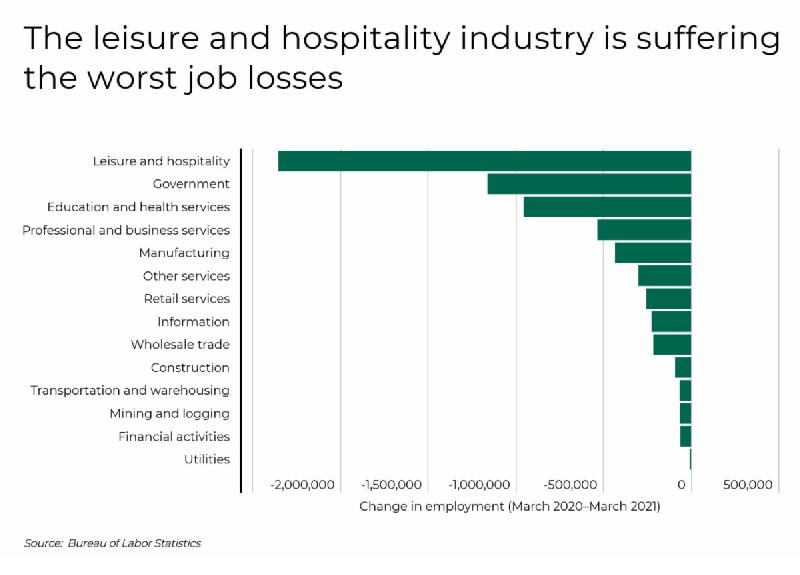
Looking at what industries COVID-19 affected most, it’s no surprise that they were the ones that didn’t benefit from the world staying at home. Across the U.S. economy, roughly a third of all job losses hit the friendly faces of waiters and waitresses, hotel receptionists, housekeepers, and attendants when travelers stopped showing up. The official BLS total came to nearly 2.5 million job losses in the leisure and hospitality sector between March of 2020 and 2021. Almost another one-third of job losses occurred in government, education, and health services.
At the state level, the obvious travel hotspots of Hawaii and Nevada, for example, led America with the largest unemployment spikes in 2020 compared to 2019. Hawaii’s unemployment surged 4.6 times what it had been, while Nevada’s went up 3.3 times.
The factors that landed Massachusetts third on that list, though, went beyond just travel. While the state has a more diversified economy, it relies on a mix of industries that were all hit hard by the pandemic restrictions. The hospitality industry thrives from Cape Cod on the Atlantic Coast to the scenic Berkshires to the west. Plus, there’s a heavy concentration of prominent universities and colleges across the state, and it’s also a hub of healthcare institutions and research labs. That’s all on top of Boston’s strong retail sector.
Other notable states that experienced particularly high job losses were New Jersey—with its coastal hospitality industry as well as strong trade and transportation sector—and New York focused heavily on all things business, restaurants, and tourism. And despite its massive economy, California has four large metro areas among the nation’s hardest-hit locations: San Francisco, Los Angeles, San Diego, and San Jose.
 To find the metropolitan areas with the largest rise in unemployment since COVID, researchers at Filterbuy calculated the year-over-year change in unemployment rate based on BLS data from 2019 and 2020.
Researchers also calculated the total number of unemployed workers in 2020, as well as the annual average unemployment rates for 2020 and 2019. To improve relevance, only metropolitan areas with at least 100,000 residents were included. Additionally, metros were grouped into cohorts based on population size: small (100,000–349,999), midsize (350,000–999,999), and large (1,000,000 or more).
Similar to the state-level trends, popular tourist destinations are over-represented among metropolitan areas with the sharpest rise in unemployment. Additionally, oil towns like Odessa and Midland, TX were hard hit as oil prices dropped to historic lows on the heels of reduced oil and gas demand.
Here are the large metropolitan areas with the largest rise in unemployment since COVID-19.
| Metro | Rank | Change in unemployment rate (YoY) | Total unemployed workers (2020) | Unemployment rate (2020) | Unemployment rate (2019) | Median annual wage (2020) |
| Las Vegas-Henderson-Paradise, NV | 1 | 3.6X | 165,513 | 14.7% | 4.1% | $37,690 |
| Orlando-Kissimmee-Sanford, FL | 2 | 3.2X | 134,464 | 10.2% | 3.2% | $36,580 |
| Boston-Cambridge-Nashua, MA-NH | 3 | 3.1X | 230,962 | 8.5% | 2.7% | $57,080 |
| San Francisco-Oakland-Hayward, CA | 4 | 3.0X | 201,350 | 8.1% | 2.7% | $61,790 |
| New York-Newark-Jersey City, NY-NJ-PA | 5 | 2.9X | 1,013,369 | 10.4% | 3.6% | $52,020 |
| Denver-Aurora-Lakewood, CO | 6 | 2.9X | 125,593 | 7.5% | 2.6% | $50,170 |
| Los Angeles-Long Beach-Anaheim, CA | 7 | 2.8X | 766,373 | 11.8% | 4.2% | $45,550 |
| San Diego-Carlsbad, CA | 8 | 2.8X | 141,814 | 9.2% | 3.3% | $48,200 |
| Miami-Fort Lauderdale-West Palm Beach, FL | 9 | 2.7X | 248,404 | 8.2% | 3.0% | $38,690 |
| Detroit-Warren-Dearborn, MI | 10 | 2.7X | 245,474 | 11.7% | 4.4% | $44,840 |
| San Jose-Sunnyvale-Santa Clara, CA | 11 | 2.7X | 74,459 | 7.1% | 2.6% | $69,620 |
| Nashville-Davidson–Murfreesboro–Franklin, TN | 12 | 2.7X | 74,267 | 6.9% | 2.6% | $40,650 |
| Seattle-Tacoma-Bellevue, WA | 13 | 2.6X | 177,107 | 8.1% | 3.1% | $58,330 |
| Providence-Warwick, RI-MA | 14 | 2.6X | 63,804 | 9.5% | 3.6% | $46,000 |
| Grand Rapids-Wyoming, MI | 15 | 2.6X | 42,822 | 7.4% | 2.9% | $39,430 |
| United States | – | 2.2X | 12,947,000 | 8.1% | 3.7% | $41,950 |
For more information, a detailed methodology, and complete results, you can find the original report on Filterbuy’s website: https://filterbuy.com/resources/states-with-largest-rise-in-unemployment-since-COVID/
source: Mike LaFirenza – LatticeNewswire.com
We Publish News 24/7. Don’t Miss A Story. Click HERE to SUBSCRIBE to Our Newsletter Now!


